

whyqd: more research, less wrangling
What is it?
whyqd provides an intuitive method for schema-to-schema data transforms for research data reuse, and for restructuring ugly data to conform to a standardised metadata schema. It supports data managers and researchers looking to rapidly, and continuously, ensure schema interoperability for tabular data using a simple series of steps. Once complete, you can import wrangled data into more complex analytical systems or full-feature wrangling tools.
whyqd ensures complete audit transparency by saving all actions performed to restructure your input data to a separate json-defined methods file. This permits others to read and scrutinise your approach, validate your methodology, or even use your methods to import data in production.
whyqd allows you to get to work without requiring you to achieve buy-in from anyone or change your existing code.
- What is it?
- Why use it?
- Development roadmap
- Ethical curation for data science
- Background and funding
- Licence
Why use it?
If all you want to do is test whether your source data are even useful, spending days or weeks slogging through data restructuring could kill a project. If you already have a workflow and established software, having to change your code every time your source data changes is really, really frustrating.
If you want to go from a Cthulhu dataset like this:
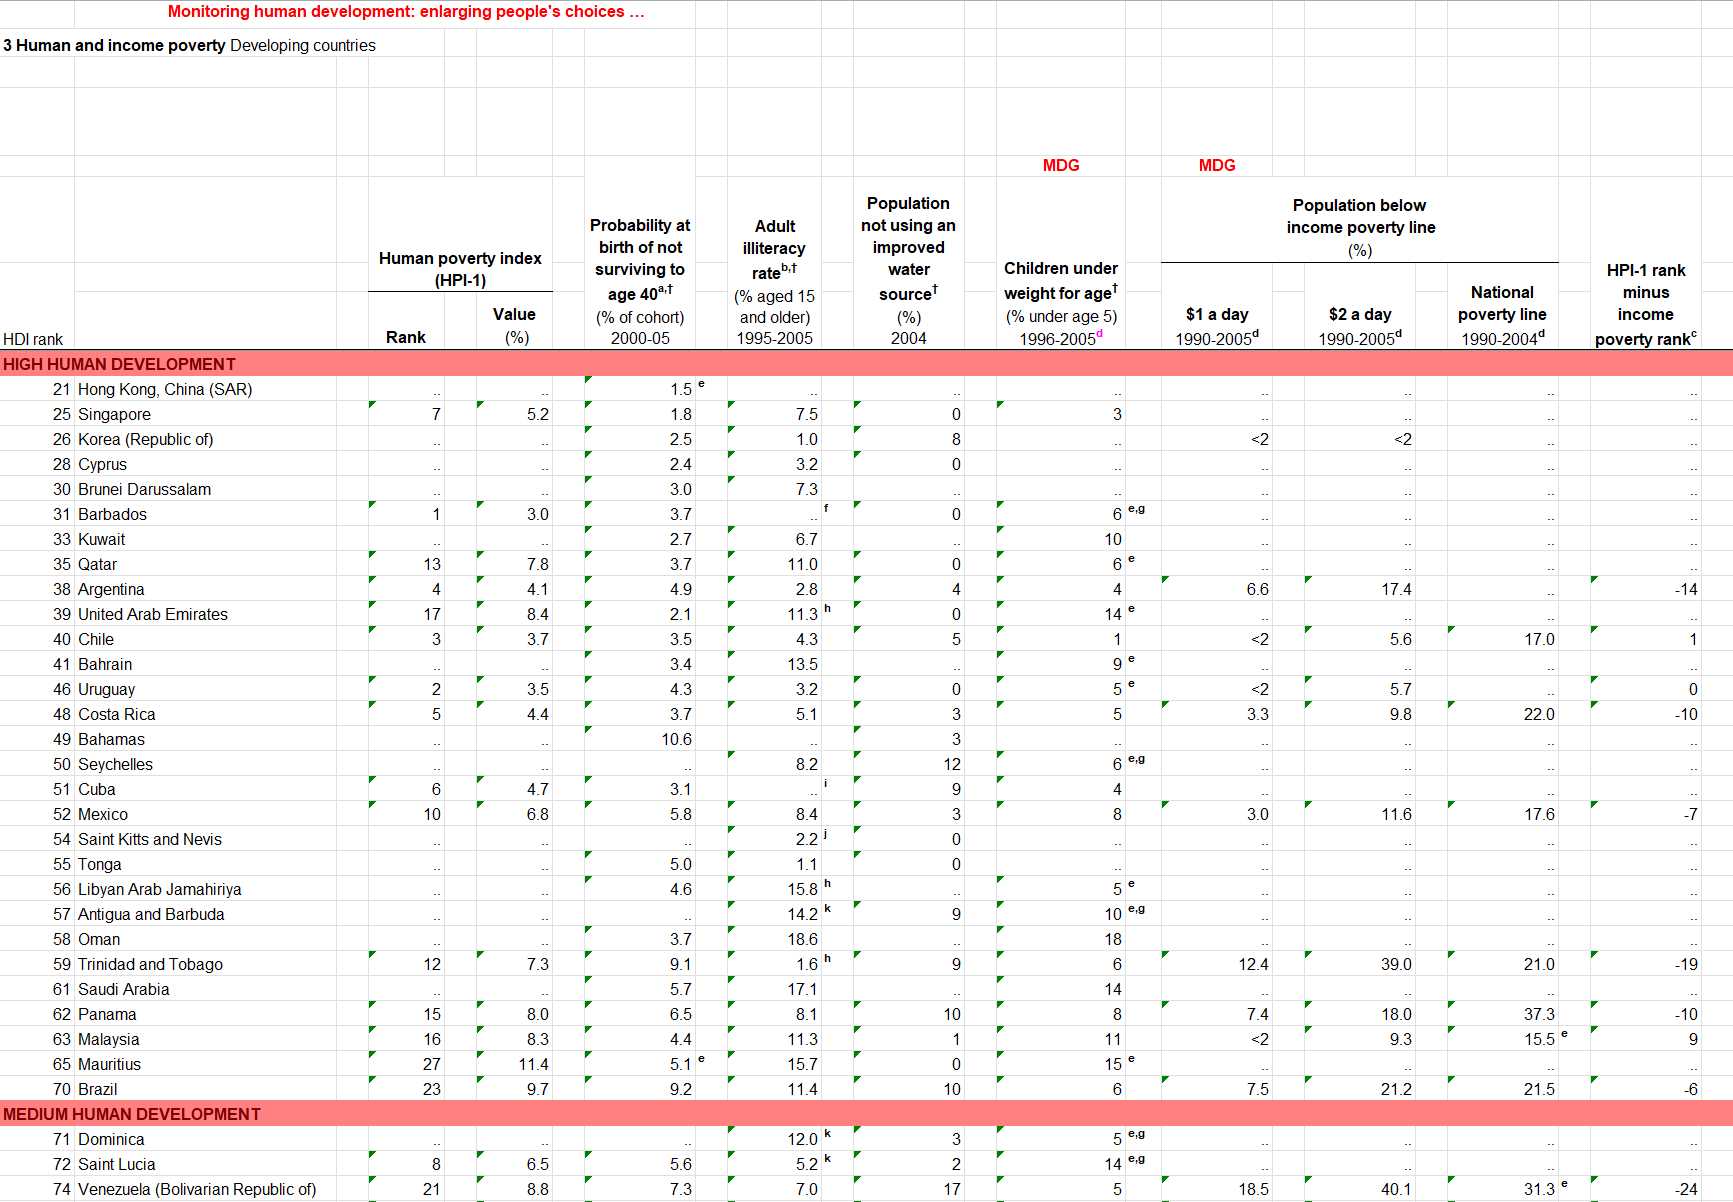
To this:
| country_name | indicator_name | reference | year | values | |
|---|---|---|---|---|---|
| 0 | Hong Kong, China (SAR) | HDI rank | e | 2008 | 21 |
| 1 | Singapore | HDI rank | nan | 2008 | 25 |
| 2 | Korea (Republic of) | HDI rank | nan | 2008 | 26 |
| 3 | Cyprus | HDI rank | nan | 2008 | 28 |
| 4 | Brunei Darussalam | HDI rank | nan | 2008 | 30 |
| 5 | Barbados | HDI rank | e,g, f | 2008 | 31 |
With a readable set of scripts to ensure that your process can be audited and repeated:
scripts = [
     "DEBLANK",
     "DEDUPE",
     "REBASE < [11]",
     f"DELETE_ROWS < {[int(i) for i in np.arange(144, df.index[-1]+1)]}",
     "RENAME_ALL > ['HDI rank', 'Country', 'Human poverty index (HPI-1) - Rank;;2008', 'Reference 1', 'Human poverty index (HPI-1) - Value (%);;2008', 'Probability at birth of not surviving to age 40 (% of cohort);;2000-05', 'Reference 2', 'Adult illiteracy rate (% aged 15 and older);;1995-2005', 'Reference 3', 'Population not using an improved water source (%);;2004', 'Reference 4', 'Children under weight for age (% under age 5);;1996-2005', 'Reference 5', 'Population below income poverty line (%) - $1 a day;;1990-2005', 'Reference 6', 'Population below income poverty line (%) - $2 a day;;1990-2005', 'Reference 7', 'Population below income poverty line (%) - National poverty line;;1990-2004', 'Reference 8', 'HPI-1 rank minus income poverty rank;;2008']",
     "PIVOT_CATEGORIES > ['HDI rank'] < [14,44,120]",
     "RENAME_NEW > 'HDI Category'::['PIVOT_CATEGORIES_idx_20_0']",
     "PIVOT_LONGER > = ['HDI rank', 'HDI Category', 'Human poverty index (HPI-1) - Rank;;2008', 'Human poverty index (HPI-1) - Value (%);;2008', 'Probability at birth of not surviving to age 40 (% of cohort);;2000-05', 'Adult illiteracy rate (% aged 15 and older);;1995-2005', 'Population not using an improved water source (%);;2004', 'Children under weight for age (% under age 5);;1996-2005', 'Population below income poverty line (%) - $1 a day;;1990-2005', 'Population below income poverty line (%) - $2 a day;;1990-2005', 'Population below income poverty line (%) - National poverty line;;1990-2004', 'HPI-1 rank minus income poverty rank;;2008']",
     "SPLIT > ';;'::['PIVOT_LONGER_names_idx_9']",
     f"JOIN > 'reference' < {reference_columns}",
     "RENAME > 'indicator_name' < ['SPLIT_idx_11_0']",
     "RENAME > 'country_name' < ['Country']",
     "RENAME > 'year' < ['SPLIT_idx_12_1']",
     "RENAME > 'values' < ['PIVOT_LONGER_values_idx_10']",
  ]
If you want to treat schema-to-schema data transformation as a straightforward technical, and not complex social, task.
Development roadmap
whyqd is under active development with an initial deployment date for end June 2023.
- Phase 0: Identify the most commonly-needed schema-to-schema transformations for release. This specific process can be continuous throughout the project.
- Phase 1: Review and improve code and script execution efficiency. Document and simplify whyqd's set of actions which define the method for data transformation for scalibility and speed.
- Phase 2: Refactoring and modernising our base stack. Improve user-interface templates in the front-end application builder.
- Phase 3: Server-side data store, transformer and validator, as well as user and team-management. Front-end web application with views for user-management, data importer and manager, and drag 'n drop data wrangler, plus scheduling for autonomous processes.
- Phase 4: The completion of the software kicks off collaboration to produce common schema-to-schema converters with key RDA interest groups.
Ethical curation for data science
There are two complex and time-consuming parts to preparing data for interoperability and analysis: social, and technical.
The social requires multi-stakeholder engagement with source data publishers and destination database users to agree structural metadata schemas. Without any agreement on data publication formats or destination structure, you are left with the tedious frustration of manually wrangling each independent dataset into a single schema for analytical use.
What constitutes a "human readable" spreadsheet causes ambiguity between people with different standpoints, and manifests as a lack of data interoperability between functionally unreadable datasets.
This lack of accessibility and interoperability locks away the vast store of existing data from historical research which could be aggregated to produce new insight.
This is a known challenge.
whyqd aims to support collaboration and interoperability through schema-to-schema transformations, and ensure the availability and validity of non-conformant, but digital, data.
1. Automate schema-to-schema data transformations between commonly-used formats
One of the more common transformation requirements to support research collaboration is to convert between schemas applied to data sourced in different research contexts. Doing so is time-consuming and has the potential to introduce opaque transformation errors.
With whyqd, instead of transforming the data, users create a schema-to-schema mapping defined by actions in a transformation method. Applying that method to a data source automatically converts and validates the data between schemas.
2. Perform non-destructive transformation of source data to conform to flexible schemas
Computers can't autonomously convert a messy, human-designed spreadsheet into a conformant schema. It takes a researcher with domain knowledge to know and understand what fields should be declared. The destructive, one-directional nature of most transformations tends to make archivists and researchers wary of committing to a destination schema without broad-based agreement from stakeholders.
In whyqd, the first step in a transformation is defining a destination schema, or using an existing one. Since this can be adjusted any time, there is no overhead or legacy commitment to defining the minimum required for research objectives.
whyqd commits each transformation step to a human-readable list of instructions. These form an auditable record of the restructuring process and can be automatically re-run on the source data to validate that the methods produce the output data.
The ad-hoc nature of this approach means that there is no need to ensure organisation-wide buy-in to a metadata schema. It encourages exploration and experimentation, ensuring data can be brought into wider use with minimum fuss.
It also encourages cross-disciplinary collaboration since each specialism can maintain their preferred schema definitions, with a simple and automatic schema-to-schema conversion process to ensure data interoperability.
3. Audit source to destination data probity through a transparent readable method
Data probity refer to the following criteria:
- Identifiable input source data with metadata and schema definitions,
- Transparent methods for restructuring of source data into analytical data,
- Accessible restructured data used to support research conclusions,
- A repeatable, auditable curation process which produces the same data.
Researchers may disagree on conclusions derived from analytical results. What they should not have cause for disagreement on is the probity of the underlying data used to produce those analytical results. If the data are wrong at the point of collection there is not much that can be done, but there is little excuse for non-auditable artifacts being introduced during the transformation process.
That's where having a transparent, human-readable transformation method, and an open source and accessible set of tools to audit the destination data, are essential.
Background and funding
whyqd was created to serve a continuous data wrangling process, including collaboration on more complex messy sources, ensuring the integrity of the source data, and producing a complete audit trail from data imported to our database, back to source. You can see the product of that at openLocal.uk.
This project has received funding from the European Union's Horizon 2020 research and innovation programme under grant agreement No 101017536. Technical development support is from EOSC Future through the RDA Open Call mechanism, based on evaluations of external, independent experts.
The 'backronym' for whyqd /wɪkɪd/ is Whythawk Quantitative Data, Whythawk is an open data science and open research technical consultancy.
Licence
The whyqd Python distribution is licensed under the terms of the BSD 3-Clause license. This whyqd hub distribution is licensed under the terms of the GNU Affero General Public License.